Making your complex data readable by everyone
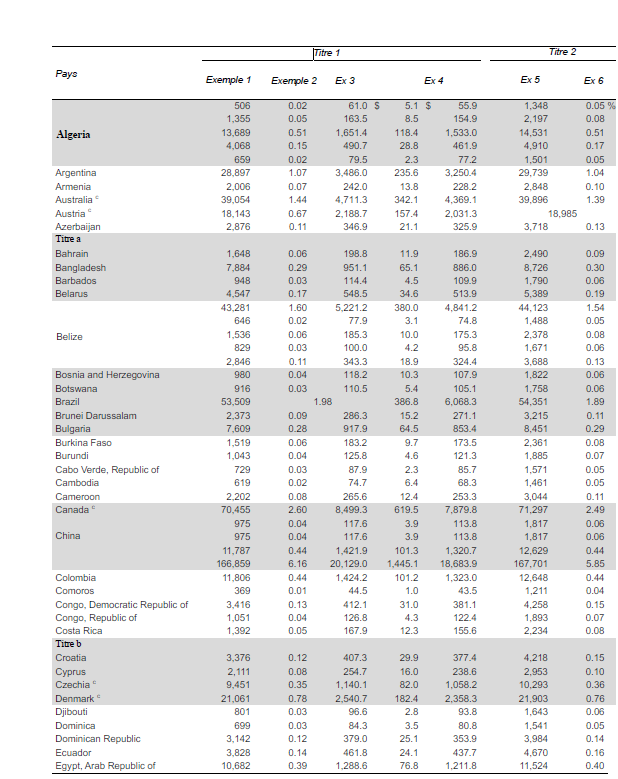
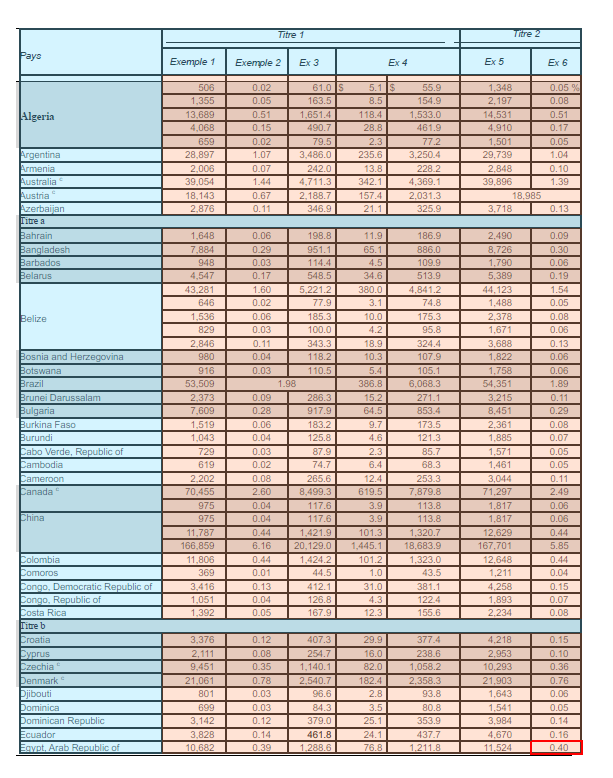
This example concretely shows the impact of our work. On the left, the raw table blocks assistive tools. On the right, our visual restructuring tool reveals our correction work: each cell is linked to its header. The document becomes fluid, logical, and fully accessible.
Give meaning to your charts and images
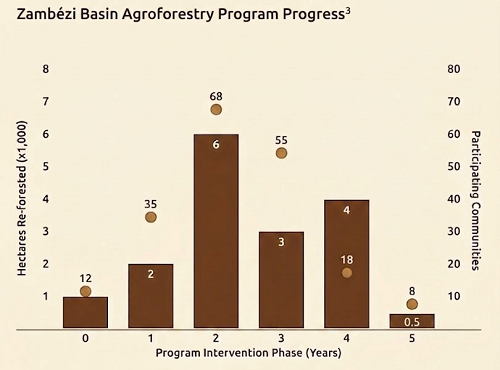
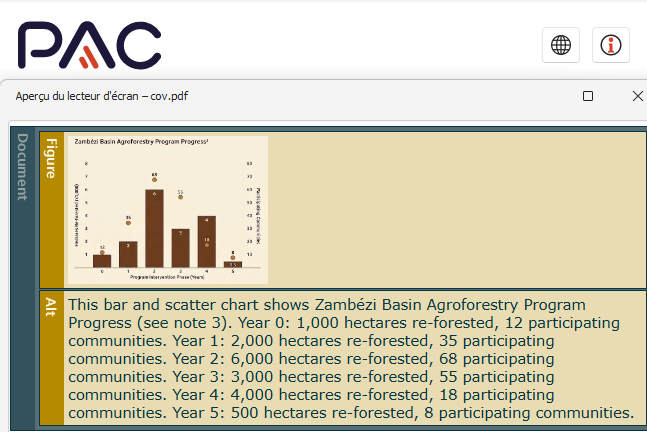
See the difference after our intervention. On the left, the original illustration is ignored by text-to-speech tools. On the right, our built-in text description faithfully conveys every visual detail: your message becomes instantly clear, understandable, and fully compliant.